By Israr Ahmed
This article looks at two approaches to creating required averaging structures, on oil indexed gas contract deals.
1. Background: Averaging Layers in the methodology ( see article )
Gas deals priced off Oil index’s usually take a lagged averaging structure over historical price period ( in relationship to delivery period). The structure is usually two nested averages: (i) average of spot within each month (ii) the average of these ‘averaged monthly spot’ prices across months specified.
Average Layer 1
In the diagram Fig1 below this is the Averaging layer 1a and 1b.
Average Layer 2
In the diagram Fig1 below this is the Averaging layer 2.
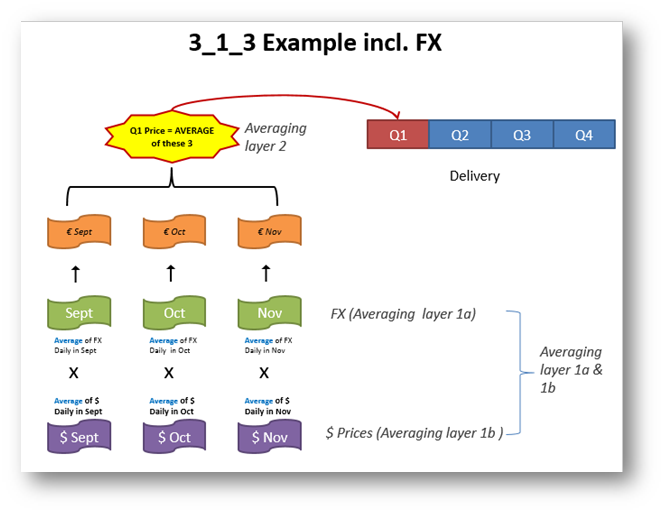
(Fig1)
2. Two different approaches
Method 1 : Projection Method using Averaging Type = Calendar Month
Selecting “Averaging Type” = “Calendar Month” on the Projection Method will do the average of average and is available in > v8. This will create a daily Reset structure on the deal.
Possible Performance issues with Daily level Resets on the Deal
Having daily resets on the deal can at some client sites create performance issues with both the large size of the Reset Events the database holds as well as the actual fixing process time taken. |
Method 2 : Splitting up the Averaging Layer onto the Curve
One possible solution is to split the two averaging such that the daily averaging is done on the curve and the monthly averaging is done on the deal:
Average Layer 1
In the diagram Fig1 above this is the Averaging layer 1b. This would be done on the Projection Index.
Average Layer 2
In the diagram Fig1 above this is the Averaging layer 2. This would be done on the Deal (which would now have monthly resets rather than daily) .
Method 1 v Method 2 : Pro and Cons
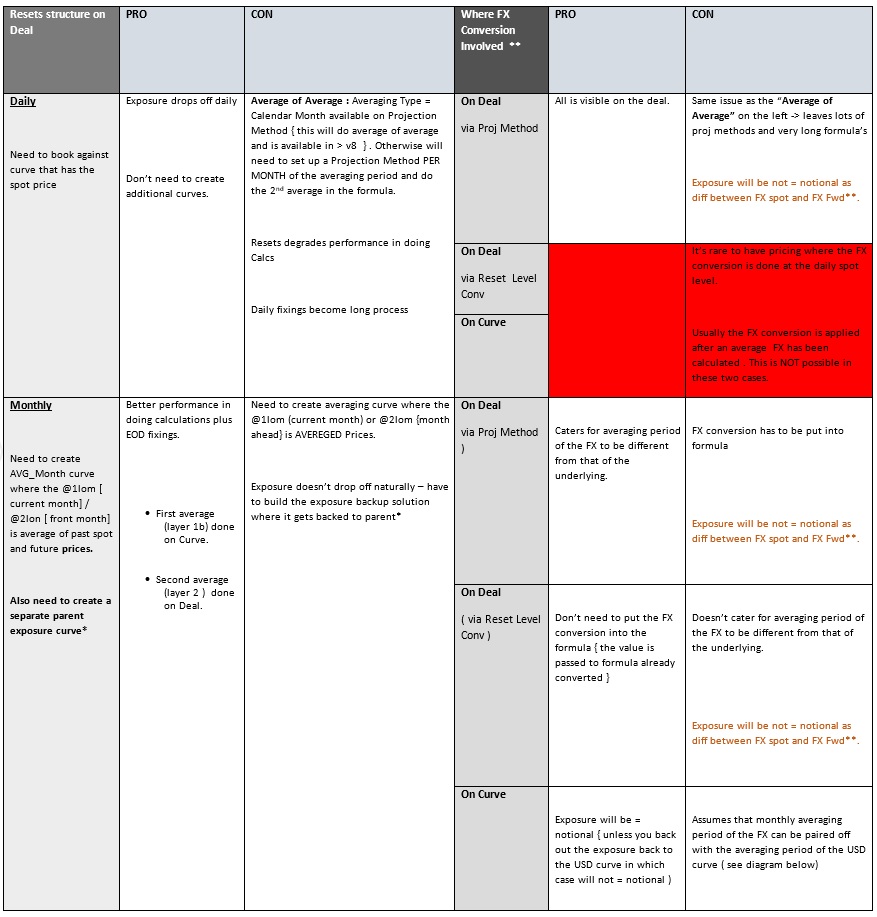
*This is a configuration which will back the exposure onto a parent curve where the configuration is such that it will only show the ‘unfixed in’ part of the exposure. This is not a trivial exercise / setup.
**This is quite an involved and complex area – see our Associated Video presentation.
| Method 1 tends to be the standard set-up. It’s the most widely used and would be first choice recommendation if performance is not likely to become an issue.However if there are performance issues with having daily resets on the deals , then Method 2 can be investigated and may be a better fit. Method 2 does though require additional complex configuration of curve structures to obtain correct exposure drop off. |
3. Additional : Reset Structure on the Physical Side
We can also use “Reset Rate Method” = “Daily Average” on the Projection Method for the Physical Leg ( only ). What this does is that it creates one reset per month in the reset table but maintains daily resets in the blobs (maintained by core code). This allows us to drop off the exposure every day as we store prices in the historical price table. This way our reset table doesn’t grow like but still gives the flexibility to roll off daily exposure as the prices become known.