By Graham Roberts
One of Endur’s key functionality is the analytic engine, which allows various ‘simulation’ results to be run. The Endur “PnL Detail” simulation result is one of the primary results for reporting PnL. It shows both Realized and Unrealized ( which depending on a setting, can either be on payment date or delivery/reset based) and is at the granularity of trade / leg (physical/financial/fix/float) / profile (month/payment period) / priceband level. This article describes some of the common issues found when reporting directly from the core PnL Detail result, and some possible options to present the data for reporting purposes.
Common Issues with reporting directly from PnL Detail
#1. PnL Detail may not be at the required Reporting granularity
- PnL Detail reports at the leg/profile/priceband granularity, which is usually too much detail for business reporting purposes, and will therefore require the same aggregation for multiple reports.
- For some trade types, PnL Detail’s granularity is not consistent. For example quarterly swaptions , Q/Y/S Futures are not broken down into monthly profiles – therefore custom code will need to be written to apportion the PnL into the appropriate bucket, according to the weighting methodology decided by the business.
#2. PnL Detail methodology not always in line with business requirement
The methodology of reporting in PnL Detail may not be in line with the business requirements, as is often the case for Futures (Closeout PnL or Margin Call is not included in PnL Detail) and some Treasury instruments, and instead the values need to be obtained from other simulation results.
#3. Calculating PnL Life To Date (LTD)
While core simulation results PnL Detail MTD and PnL Detail YTD carry Matured/Cancelled trades forward until the end of the reporting horizon, they are not carried forward in PnL Detail – which means that once a trade has matured/is cancelled, it drops out of the PnL Detail results.
#4. Bug fixes
It may not be desirable/practical to take an upgrade immediately if a bug is found in PnL Detail. Rather than creating workarounds in every report, it is preferable to implement a fix to the logic in one place which can then be unwound easily once an upgrade is taken.
Solution Options
Given the above issues, there is some consideration over where to implement fixes and aggregation for PnL Detail to avoid unnecessary duplication of code:
Option 1: Overwrite PnL Detail
There are two ways in which it is possible to directly overwrite the PnL Detail results when saving the result down for use by reports:
Method 1 : User Defined Sim Result (UDSR) to overwrite PnL Detail values
A User Defined Sim Result – configured to be dependent on PnL Detail – can be created with the sole aim of overriding the PnL Detail result. When the UDSR runs, it gets passed the PnL Detail table. By overriding the PnL Detail table within the UDSR, then saving the UDSR result, the adjusted PnL Detail result will also be saved. However, while this method has been employed in real instances of Endur, it is not possible to determine the order that the UDSR runs against the core simulation results, therefore PnL Detail dependant values may not be derived correctly (one of the key distinguishing features of using OpenComponent Results Calculator). Furthermore, overwriting the core result in this way may be less visible from a coding perspective and therefore may not be considered best practice.
Method 2 : External Pricing Model (EPM) / Result Calculator (RC)
An alternative and more transparent way of changing the result is to use the Endur functionality provided.
- An External Pricing Model is used to calculate MtM value (or other variables such as prices, volumes, volatilities, greeks etc) when the required pricing model is not available in Endur (ie Swing contracts / Storage / Exotics). With regards to MtM, this value is then fed by Endur into PnL Detail. However one of the limitations of EPM by itself is that it cannot influence the Realised/Unrealised split on the PnL Detail.
- The Results Calculator allows a core simulation result to be adjusted, therefore providing full control to adjust realised/unrealised values and add rows. It can be invoked at the instrument level to avoid performance issues due to unnecessary calls. Note that the Result Calculator is not currently available for all simulation results, but the list is being expanded with every release of Endur.
When the PnL Detail can be calculated within Endur using existing sim results / data then only a Results Calculator is needed.
When the PnL Detail valuation genuinely cannot be calculated within Endur (using other Endur sim results / data) and needs an EPM then usually a combination of EPM and Results Calculator is needed to match the EPM granularity / info onto the Endur simulation results (ie the EPM calculates the values including realised/unrealised, and the Results Calculator attributes those results correctly into the sim result). In this scenario there are multiple ways for the RC to get the result from the EPM, either by calling it directly, or by writing logic into the EPM to save down the result somewhere that the RC can later access it (for example the pricing details table, providing the solution is designed to always call the EPM prior to Results Calculator running).
Option 2: Create a User Defined Sim Result
Rather than creating reports which directly access PnL Detail, a UDSR can be created to load up PnL Detail (and any other results as necessary), and present a common logic / granularity result for all instrument types.The advantage of this option beyond simply overwriting PnL detail are
- Comprehensibility : A consistent and common result for all Instruments)
- Less risky than overwriting PnL Detail – can always reconcile back to PnL Detail
- Some of the aggregation is done in one place rather than spread across multiple reports
Some of the disadvantages are:
- Divergence from core results
- Using a UDSR for pnl may potentially mean that the result may start to diverge from other core sim results, such as the PnL in the core PnL Explained result. This is mitigated by overwriting PnL Detail (from which the PnL Explained gets it’s result), however other calculations such as Delta are derived from other sim results – therefore if there needs to be a wholesale change in valuation model throughout PnL Detail and MTM (for Delta calculation) an External Pricing model would be the correct solution.
- Multiple UDSRs may be required
- If there is a requirement to report on MTD or YTD, then additional UDSRs will need to be created on top of the core PnL Detail MTD or PnL Detail YTD results.
- Duplication of data
- Additional data storage required to save down the UDSR. This is especially true if it is used to calculate a cumulative Life To Date for all trades, which may require an archiving strategy
Option 3: External Reporting Tool
This brings many of the benefits of Option 2, however rather than use the trading system resources to create the presentation layer and further aggregate the data into reports, it may make more sense to export the core sim results into an external reporting database. Using a dimensional model for the data, such as a cube, can bring additional advantages:
- Data can be “sliced and diced” as required, rather than being constrained by pre-specified report formats
- Business users, rather than developers can create new reports
- Trading system resources freed up for trading, decoupled from reporting performance and data storage which can be serviced separately
There are two key models applicable to external reporting solutions which are standard tools used in Business Intelligence:
- Multidimensional (Traditional OLAP Cube)
- Tabular (in-memory cube)
These models are both aimed at providing the same service – taking raw data and aggregating it into a presentation layer, which can then be quickly accessed via flexible reporting driven by the user. However they are designed in fundamentally different ways.
- Multidimensional models aggregate the data into a desired format that can then be quickly accessed for reporting purposes, and then save these formatted tables down to disk for access by reporting services. The design can either be real time (where the cube detail and aggregated data are stored on the relational database source) or offline (most common, where the data is aggregated and stored on a separate Analysis Services server in a compressed and optimised multidimensional format leading to faster reporting)
- Tabular models, rather than saving an aggregated results table to disk, will either run in Cached mode (most common, loading all data into memory on the server in the desired column format) or Direct Query mode (directly accessing data on the database source).
It is not the intention of this article to fully contrast the two different approaches, however some key considerations are:
- Multidimensional reporting is commonly perceived as requiring a more complex data language to Tabular reporting solutions, so tends to require more specialist skills to implement it.
- Tabular reporting, running in Cached mode, can be constrained by the amount of RAM available
A good assessment of the merits of both models can be found at the following link: Tabular vs Multidimensional Modelling
Example of dimensional modelling for middle office reporting
To further illustrate how an external reporting tool might be implemented for PnL Detail, a simplified example is described below. Correct design of data for a dimensional model is important as it can bring multiple benefits, including:
- Comprehensibility: easier to understand the data compared to viewing sim results directly within Endur. For example pnl values will be contained in a common format for all instruments rather than requiring knowledge of which sim results to obtain the data from
- Extensibility: other sim results, such as Delta could also be exported for VaR reporting using the same model.
- Optimal data storage (ie duplication of data vs query performance)
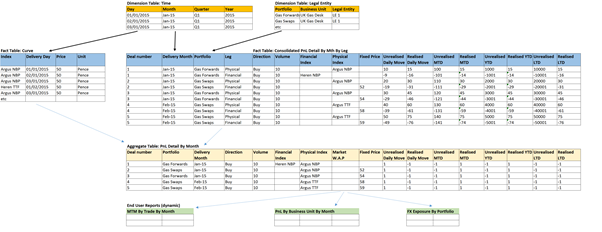
The design will vary, as data modelling decisions will be based on the specific business requirements. When designing the data structure, standard dimensional modelling techniques dictate that first the “grain” should be identified (ie the values and lowest level of granularity required), for example the grain might be “PnL at the trade/month/leg level“.
The data model should then consist of:
- “fact” tables, containing the numerical data at the lowest level of granularity that you wish to report on. In the case of middle office reporting there would be multiple fact tables providing values which the reports need access to from the Endur sim results, such as:
- PnL and MTM for live trades at the trade/month/leg level
- LTD values for Matured Trades
- Market Prices at the gridpoint level
The fact tables would also contain standard calculations based off these results, such as pnl movements
- “dimension” tables, containing the various dimensions in which the data is to be aggregated – in the case of middle office reporting this would include time dimensions (such as months, quarters and years), portfolio to legal entity hierarchy, physical locations to grids/pipelines and countries etc
- “aggregate” tables, whereby any common aggregations likely to be required for multiple reports (eg summing values to portfolio level) can be done in one place during the overnight batch run to speed up performance of the end user reports
Conclusion
Of course the likely solution for reporting from PnL Detail, and addressing the main issues, is a combination of the options described above.
Fixing issues and changing valuation methodologies is better done as close to the source of the data as possible, rather than in the reporting layers, especially if the data will be used elsewhere throughout the system. Simply changing simulation result data in one of the reporting layers (overwriting PnL Detail directly, overwriting PnL Detail via the Results Calculator, or creating a UDSR with corrected valuations) may not be enough if the valuation itself needs to change in order to get the correct Delta valuation. In this case, only an EPM will provide a consistent result throughout.
Once the core data is in line with requirements, reporting layers may be better focussed on their primary aim – flexible reporting and faster aggregation of data.