by Israr Ahmed
Gas deals can be based off indexed prices. A common gas pricing structure involves averaging across historic oil published prices. The methodology is encapsulated by the following three parameters X / Y / Z .
See also related article on modelling these averaging methods using Projection Methods in Endur.
Naming Convention for Averaging Method: X_Y_Z
Best to read this Right to Left
- X= averaging period = number of months over which average is taken
- Y= lag months = the number of months back from pricing Block start that the averaging period ends ( 0 = averaging period ends at month end prior to pricing Block start)
This parameter tells you how far back from the start of each Pricing Block the averaging period ends . Its important to appreciate that the averaging span is always assumed to be in the past so Y=0 means that the averaging period ends just prior to the start of the Pricing Block. Y=1 means that the averaging period ends one calendar month before the start of the Pricing Block.
- Z = use months = pricing Block (starting from 01Jan) . The average used within a pricing Block will be same.
If Z= 1 it means that each month is a Pricing Block and so the average price used in each month JAN, FEB , …., DEC will be all different.
If Z = 2 it means that JAN&FEB , MAR&APR , MAY&JUN , JUL&AUG …. Are Pricing Blocks and will use the same price within the Block.
*pricing block can sometimes reference gas year rather than calendar year
Examples
| GO | 8_1_2 | use 8mnth average of Aug08->Nov08 for Jan09 & Feb09.use 8mnth average of Sep08->Dec08 for Mar09 & Apr09 | = arithmetic average of the 8 monthly values (X=8) the GO ending one month prior to each recalculation date ( Y=1 ). Recalculation dates are the 1st day of Jan , Mar , May ,Jul, Sep, Nov (Z=2) |
| FO | 4_0_1 | use 4mnth average of Sep08->Dec08 for Jan09 | = arithmetic average of the 4 monthly values (X=4) of FO ending immediately prior to the recalculation date (Y=0). Recalculation date are the 1st day of each month ( Z=1) |
Some Complexities
There are two sources of complexity to this above explanation.
1.Average of Average
The averaging period X usually represents two averages.
- Average of spot per business day within a calendar month. This is labelled as “Averaging Layer 1b” in Fig 1 below.
- Average of the individual monthly averages. This is labelled as “Averaging Layer 2” in Fig 1 below.
2. FX Conversion of $ Oil Prices
For European gas in EUR the averaging of $ Oil prices is usually converted to EUR using a similar averaging method to that used for the underlying $ Oil price. This is labelled as “Averaging Layer 1a” in Fig 1 below.
[This is an involved and potentially complex area – see our Associated Video presentation.]
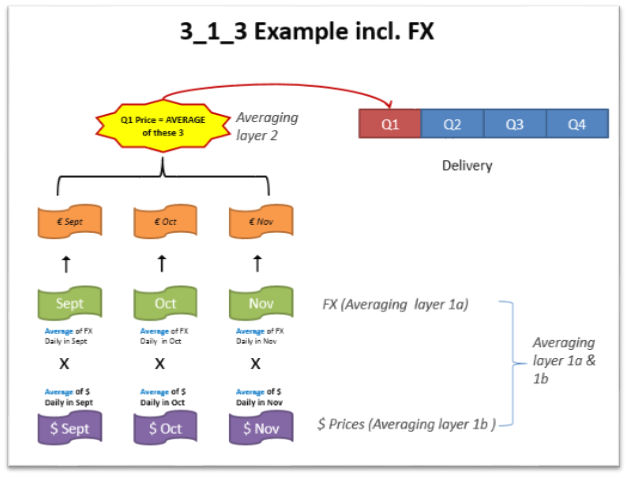
(Fig1)